| asset_name | category | baseline_fuel | project_fuel | baseline_efficiency | project_efficiency | annual_baseline_fuel_qty | fuel_unit | unit_cost_usd | useful_life_years | |
|---|---|---|---|---|---|---|---|---|---|---|
| asset_id | ||||||||||
| ics_rocket | Improved Cookstove (Rocket) | cooking | firewood | firewood | 0.10 | 0.25 | 2628 | kg | 40 | 5 |
| epc | Electric Pressure Cooker | cooking | charcoal | electricity | 0.15 | 0.85 | 1095 | kg | 90 | 7 |
| lpg_stove | LPG Cookstove | cooking | firewood | lpg | 0.10 | 0.55 | 2628 | kg | 60 | 8 |
| ethanol_stove | Ethanol Cookstove | cooking | charcoal | ethanol | 0.15 | 0.50 | 1095 | kg | 55 | 6 |
| biogas | Household Biogas Digester | cooking | firewood | biogas | 0.10 | 0.55 | 2628 | kg | 650 | 15 |
| refrigerator | Energy-Efficient Refrigerator | appliance | none | electricity | 0.00 | 0.00 | 810 | kWh | 350 | 12 |
| solar_fridge | Solar DC Refrigerator | appliance | grid_or_diesel | solar | 0.00 | 0.00 | 810 | kWh | 600 | 10 |
Overview
This report estimates the carbon performance and economics of a portfolio of clean-cooking and productive-use (PUE) assets i.e., improved cookstoves, electric pressure cookers, LPG and ethanol stoves, biogas digesters, and energy-efficient or solar refrigerators.
The underlying model is driven by three editable inputs:
| File | What it controls |
|---|---|
config.yml |
Portfolio size, crediting period, carbon prices, Gold Standard fees, monitoring discounts |
data/asset_catalogue.csv |
Per-asset fuel switch, efficiencies, baseline fuel use, capex, useful life |
data/emission_factors.csv |
IPCC / EPA emission factors, calorific values, fNRB |
Change a number, re-render, and every table and chart below updates. The report answers three questions:
- How much CO₂e does each asset and the whole portfolio reduce per year?
- What carbon-credit revenue does that generate across price scenarios?
- What does Gold Standard certification cost, and is the project net-positive?
Methodology basis
The emission-reduction logic follows the Gold Standard for the Global Goals (GS4GG) cookstove approach and the CDM/GS principle:
\[ ER = BE - PE - LE \]
where emission reductions (\(ER\)) equal baseline emissions (\(BE\)) minus project emissions (\(PE\)) minus leakage (\(LE\)). Biomass-cooking baselines are converted to CO₂e using the Fraction of Non-Renewable Biomass (fNRB), the same displacement-of-non-renewable-biomass logic behind the CDM’s fNRB tools. Fuel-switch and electricity cases use IPCC default emission factors and a grid emission factor. Net credits are then discounted for drop-off, stove stacking and usage per the GS4GG monitoring guidance.
The asset portfolio
The table below lists every asset type in the model, the fuel switch it represents (baseline fuel → project fuel), the efficiency of the baseline and project technology, how much baseline fuel a typical unit consumes per year, its unit cost, and its expected useful life. These are the per-asset parameters that drive every downstream calculation.
The scenario modelled here deploys the following number of units of each asset, this is the portfolio size set in config.yml:
| asset_id | units_deployed | |
|---|---|---|
| 0 | ics_rocket | 5000 |
| 1 | epc | 2000 |
| 2 | lpg_stove | 1000 |
| 3 | ethanol_stove | 800 |
| 4 | refrigerator | 500 |
Emission reductions
For each asset we compute baseline emissions, project emissions, leakage, and the net emission reduction after monitoring discounts. Net reductions are what actually convert into issued credits (VERs).
The table below breaks that calculation down per unit of each asset type: baseline emissions if nothing changed, project emissions from the new technology, an estimated leakage deduction, the resulting gross reduction, the combined monitoring-discount factor (drop-off, stacking, usage), and finally the net tCO₂e credited per unit per year.
| Asset | Baseline tCO2e/unit | Project tCO2e/unit | Leakage | Gross tCO2e/unit | Monitoring adj. | Net tCO2e/unit/yr | |
|---|---|---|---|---|---|---|---|
| 0 | Improved Cookstove (Rocket) | 0.795 | 0.000 | 0.040 | 0.795 | 0.689 | 0.520 |
| 1 | Electric Pressure Cooker | 0.552 | 0.161 | 0.020 | 0.391 | 0.689 | 0.256 |
| 2 | LPG Cookstove | 1.325 | 0.452 | 0.044 | 0.872 | 0.689 | 0.571 |
| 3 | Ethanol Cookstove | 0.552 | 0.000 | 0.028 | 0.552 | 0.689 | 0.361 |
| 4 | Energy-Efficient Refrigerator | 0.162 | 0.097 | 0.000 | 0.065 | 0.900 | 0.058 |
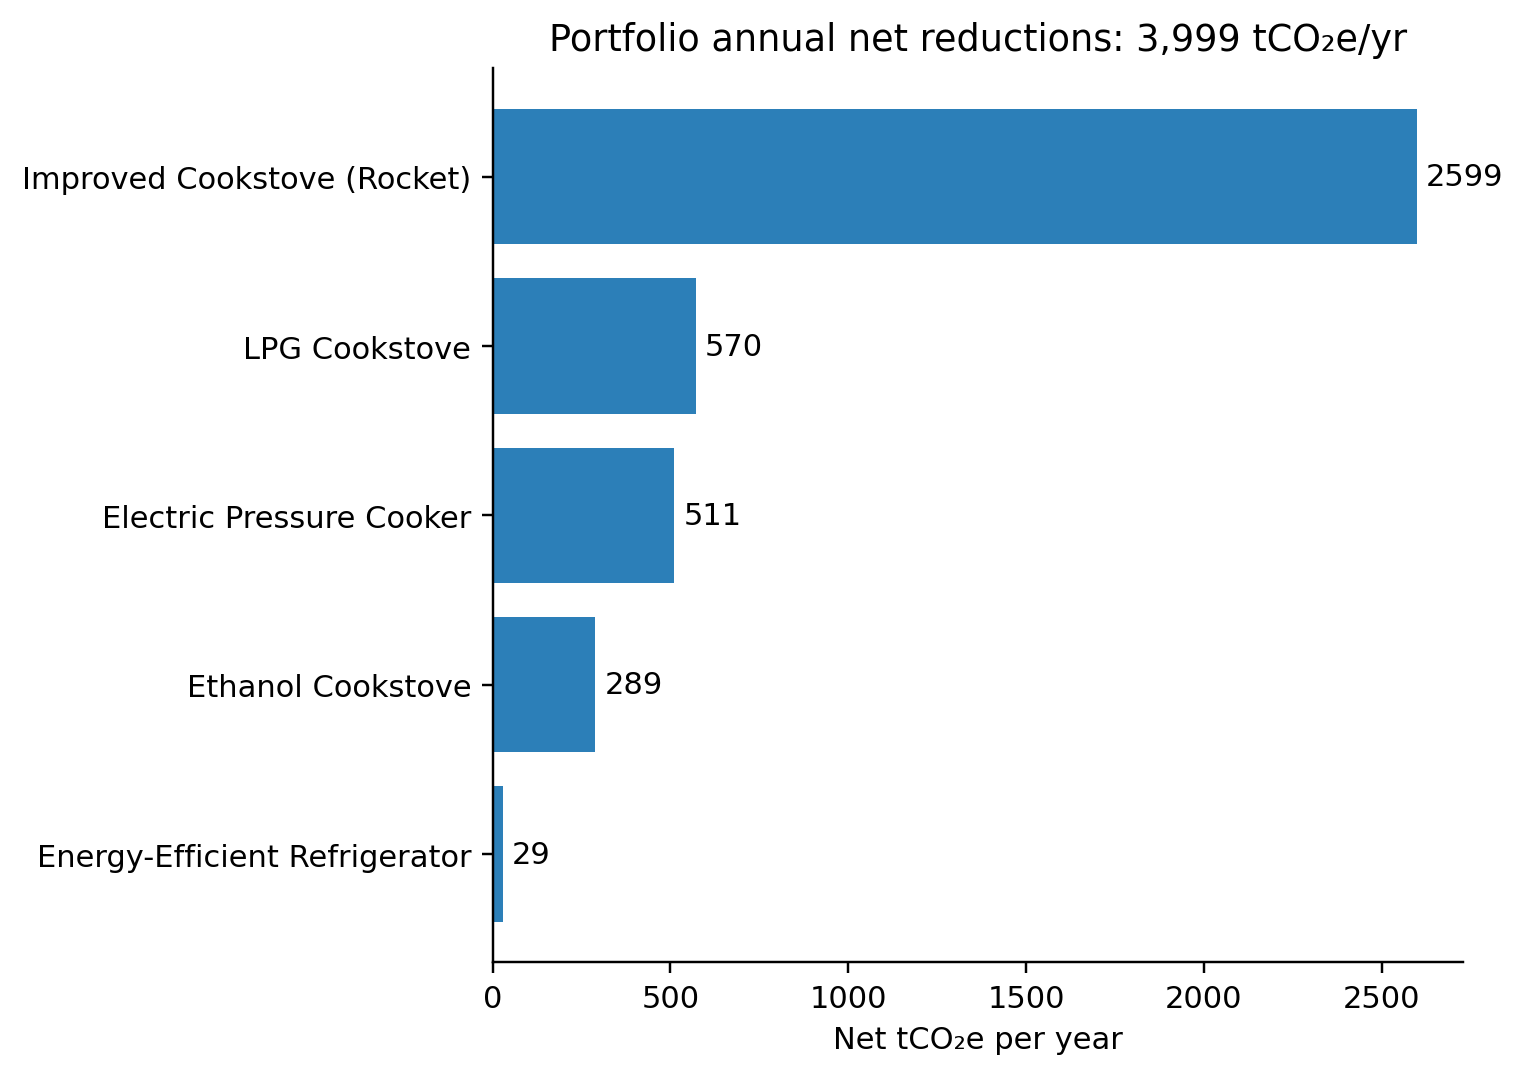
Multiplying each asset’s net per-unit reduction by the number of units deployed gives the portfolio roll-up: total annual net tCO₂e and total capex by asset type.
| asset_id | asset_name | category | units | net_tco2e_per_unit_yr | annual_net_tco2e | unit_cost_usd | capex_usd | |
|---|---|---|---|---|---|---|---|---|
| 0 | ics_rocket | Improved Cookstove (Rocket) | cooking | 5000 | 0.5198 | 2599.0 | 40 | 200000 |
| 1 | epc | Electric Pressure Cooker | cooking | 2000 | 0.2556 | 511.3 | 90 | 180000 |
| 2 | lpg_stove | LPG Cookstove | cooking | 1000 | 0.5705 | 570.5 | 60 | 60000 |
| 3 | ethanol_stove | Ethanol Cookstove | cooking | 800 | 0.3610 | 288.8 | 55 | 44000 |
| 4 | refrigerator | Energy-Efficient Refrigerator | appliance | 500 | 0.0583 | 29.2 | 350 | 175000 |
The chart orders assets by their contribution to total annual net reductions, making it easy to see which asset types drive most of the portfolio’s carbon impact.
Reading the result
The portfolio delivers 3,999 tCO₂e per year of net verified reductions. Over the 5-year crediting period that is 19,994 credits (before any year-on-year deployment growth).
Carbon-credit revenue
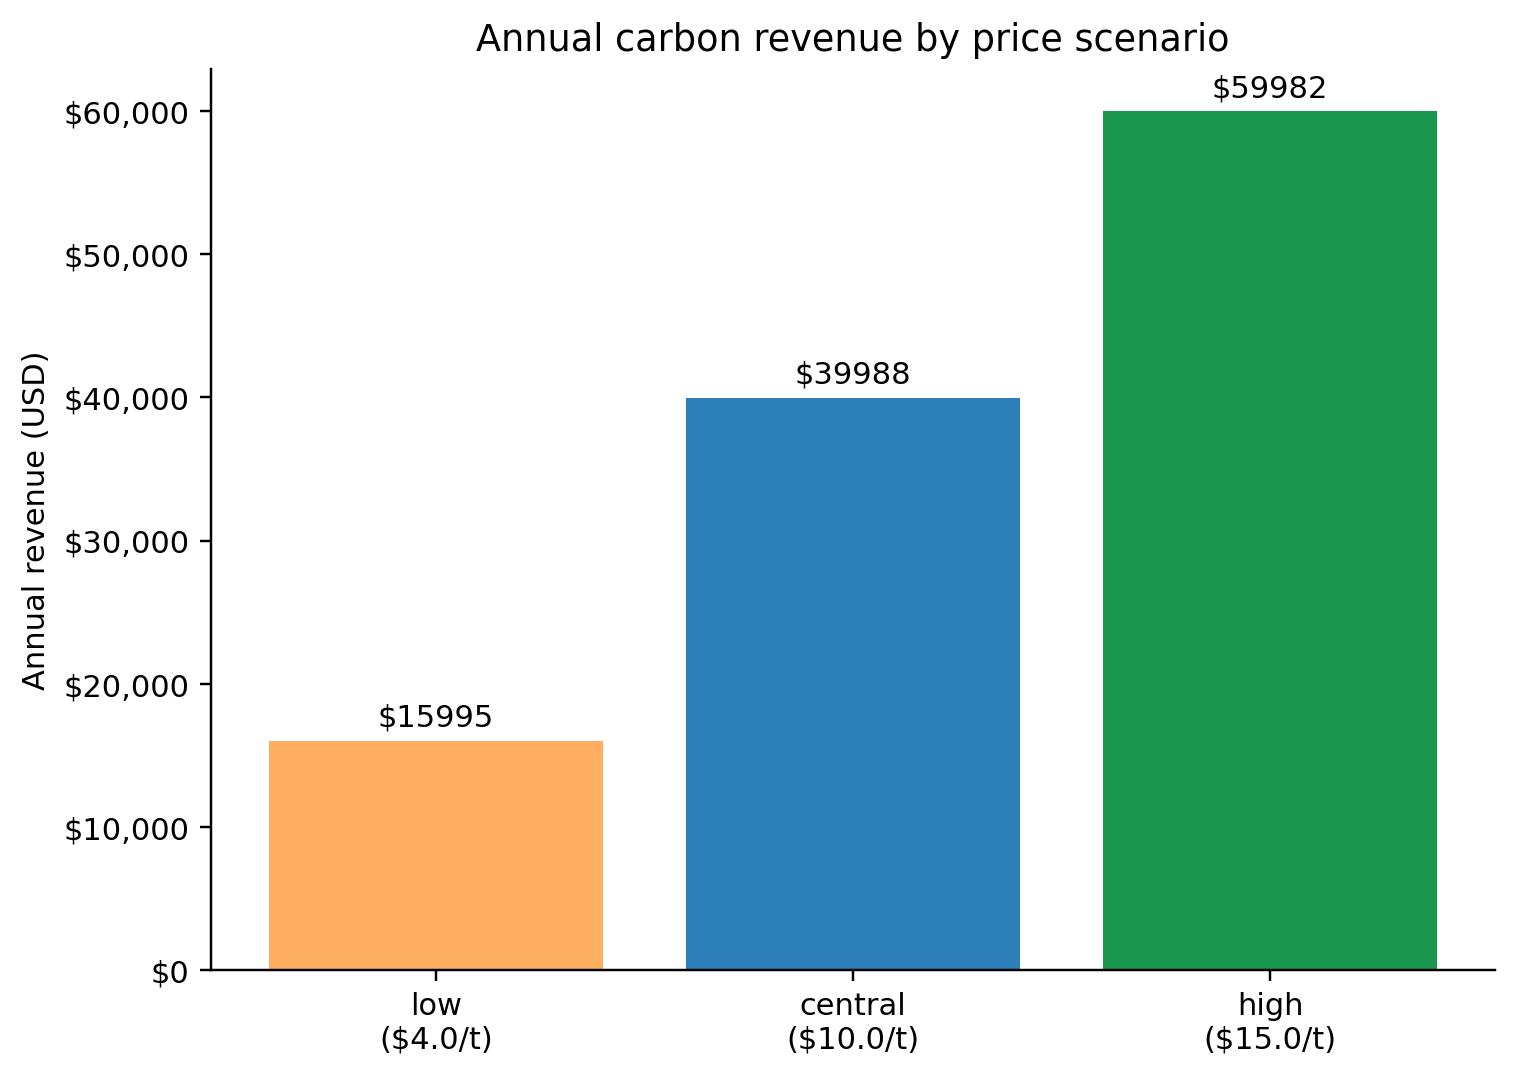
One credit = 1 tCO₂e avoided. We model three voluntary-market price scenarios (USD/VER) set in config.yml. The table shows annual revenue under each scenario, assuming the full portfolio’s net reductions are issued and sold every year of the crediting period.
| year | revenue_low_usd | revenue_central_usd | revenue_high_usd | |
|---|---|---|---|---|
| 0 | 1 | 15995.0 | 39988.0 | 59982.0 |
| 1 | 2 | 15995.0 | 39988.0 | 59982.0 |
| 2 | 3 | 15995.0 | 39988.0 | 59982.0 |
| 3 | 4 | 15995.0 | 39988.0 | 59982.0 |
| 4 | 5 | 15995.0 | 39988.0 | 59982.0 |
The chart puts the same three scenarios side by side to show how sensitive revenue is to the price assumption alone, holding the physical reductions constant.
Gold Standard certification costs
Getting a project registered and issuing credits under GS4GG is not free, Gold Standard, its designated auditor (SustainCERT), and the third-party Validation/Verification Body (VVB) each charge fees at different stages of the project lifecycle. The cost model below itemises those stages so the economics can be checked against carbon revenue rather than assumed to be negligible:
- Annual registry fee: a flat fee to keep the project listed on the Gold Standard Impact Registry, charged every year of the crediting period.
- Preliminary and design review fees: one-off fees paid when the Project Design Document (PDD) is first submitted and reviewed against the chosen methodology.
- VVB validation fee: paid to an independent, accredited VVB to validate the PDD before the project can be registered (and again at each crediting period renewal).
- Performance review and VVB verification fees: paid each time a monitoring period is verified, confirming the emission reductions claimed actually occurred.
- Per-credit issuance fee: a small fee charged per credit issued; this model uses $0.15/credit in the first issuance and $0.30/credit in subsequent years, in line with typical GS4GG issuance pricing.
- Consultancy: an estimated ongoing cost for the technical work of preparing the PDD and annual monitoring reports, which in practice is usually contracted out rather than done by GS/SustainCERT themselves.
These cost categories and typical magnitudes follow Gold Standard’s published fee schedule and common practice for programmatic clean-cooking/biogas projects (e.g. umbrella Programmes of Activities such as biogas PoAs in Africa, which spread registry and VVB fees across many small project activities). The exact figures are placeholders set in config.yml → gs_costs_usd; replace them with your VVB’s quoted fees and Gold Standard’s current fee schedule before using this for real budgeting.
The table below shows the year-by-year total cost and the issuance-fee component specifically, over the crediting period.
| year | total_cost_usd | issuance_fee_usd | |
|---|---|---|---|
| 0 | 1 | 30500.0 | 600.0 |
| 1 | 2 | 23700.0 | 1200.0 |
| 2 | 3 | 23700.0 | 1200.0 |
| 3 | 4 | 23700.0 | 1200.0 |
| 4 | 5 | 23700.0 | 1200.0 |
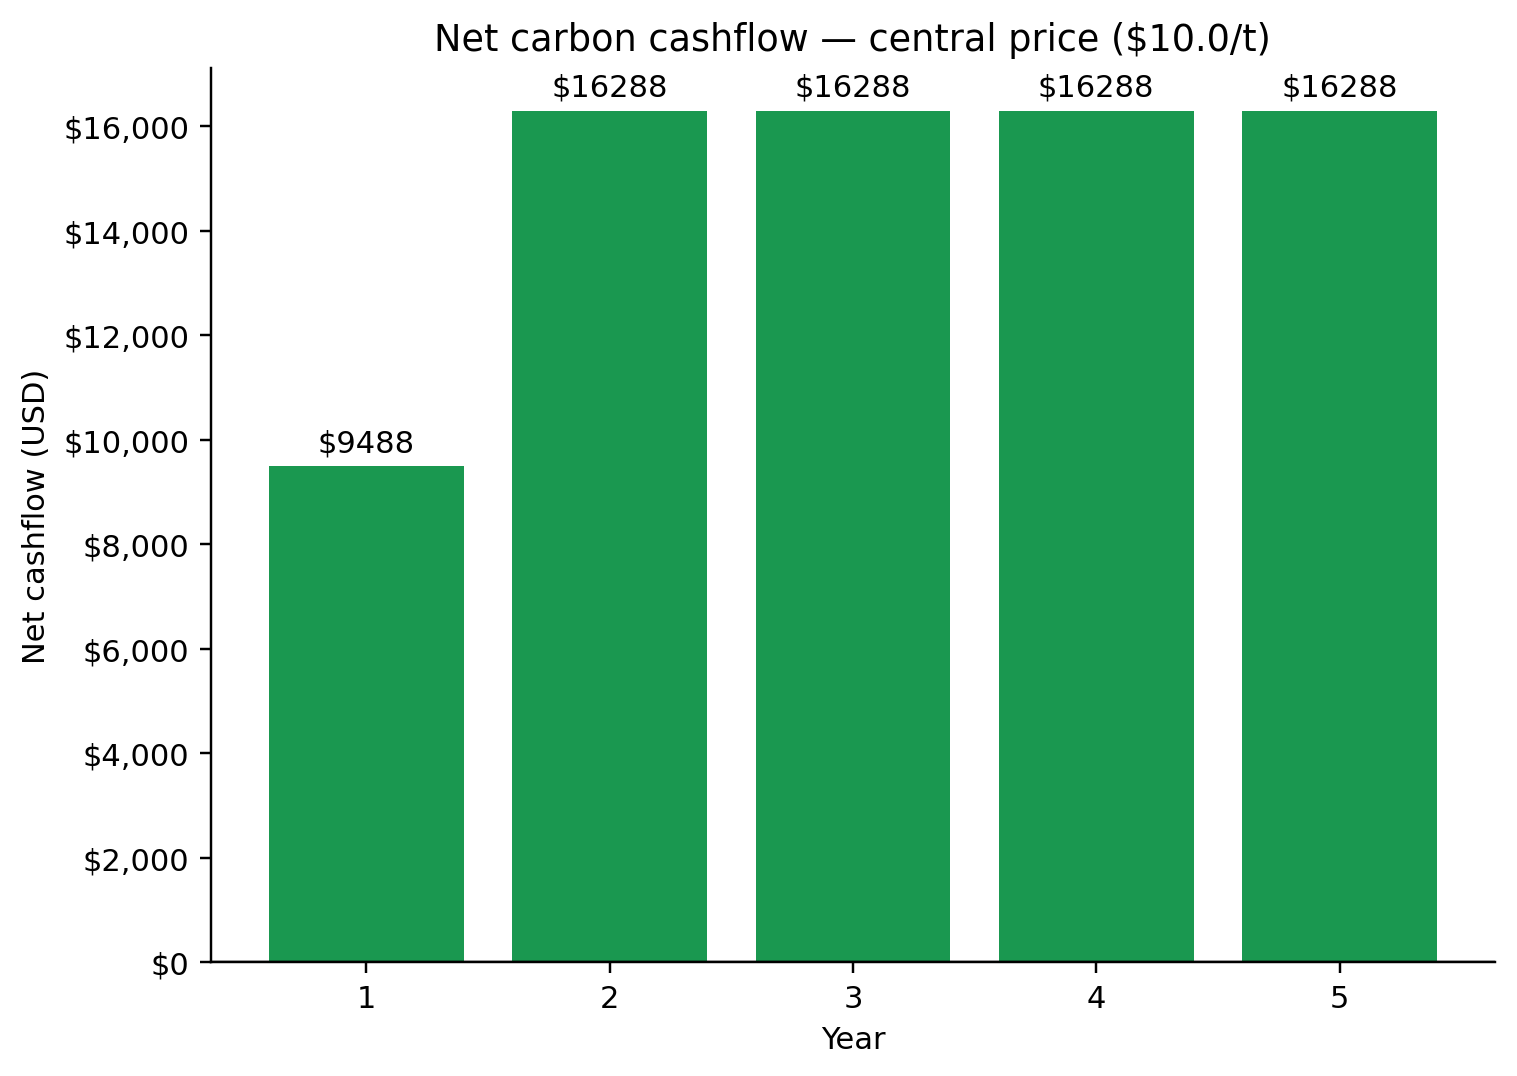
Combining revenue at the central price scenario with these certification costs gives the net cashflow attributable to carbon credits alone, year by year:
| year | revenue_usd | gs_cost_usd | net_cashflow_usd | |
|---|---|---|---|---|
| 0 | 1 | 39988 | 30500 | 9488 |
| 1 | 2 | 39988 | 23700 | 16288 |
| 2 | 3 | 39988 | 23700 | 16288 |
| 3 | 4 | 39988 | 23700 | 16288 |
| 4 | 5 | 39988 | 23700 | 16288 |
The chart highlights any year where certification costs exceed carbon revenue (shown in red) — typically the first year, when validation and PDD review fees are concentrated.
Bottom line
At the central price of $10.0/tCO₂e, the project’s net present value (10% discount) over the crediting period is $61,119**.
Note: this counts carbon revenue against carbon-certification costs only, it excludes asset capex ($659,000 total), distribution, and financing, which an asset-financing partner recovers separately through customer repayments on the underlying stove/appliance loan plan.
Carbon footprint of an individual customer
A quick household-level calculator, useful for impact reporting and customer communication. It estimates the annual baseline cooking footprint for one household on traditional biomass, and translates that into two more intuitive comparisons: equivalent car-driving distance, and “trees-worth” of wood saved by switching to an efficient stove.
| Annual baseline cooking footprint (tCO2e) | Equivalent km driven (petrol car) | Trees-worth of wood saved/yr (ICS, 50%) | |
|---|---|---|---|
| 0 | 1.325 | 5641.0 | 6.7 |
The “trees saved” figure is illustrative, not a certified methodology output. It assumes an average tree mass of roughly 195.5 kg of harvestable wood, a convention used by several East African cookstove/reforestation programmes for translating fuelwood savings into a more intuitive “trees” unit, and a 50% reduction in fuel use from an efficient stove relative to a traditional three-stone fire. Both figures are rough averages; a rigorous estimate would use species and region-specific biomass data (e.g. from national forest inventories) rather than a single global convention.
Sensitivity: how price and fNRB drive the result
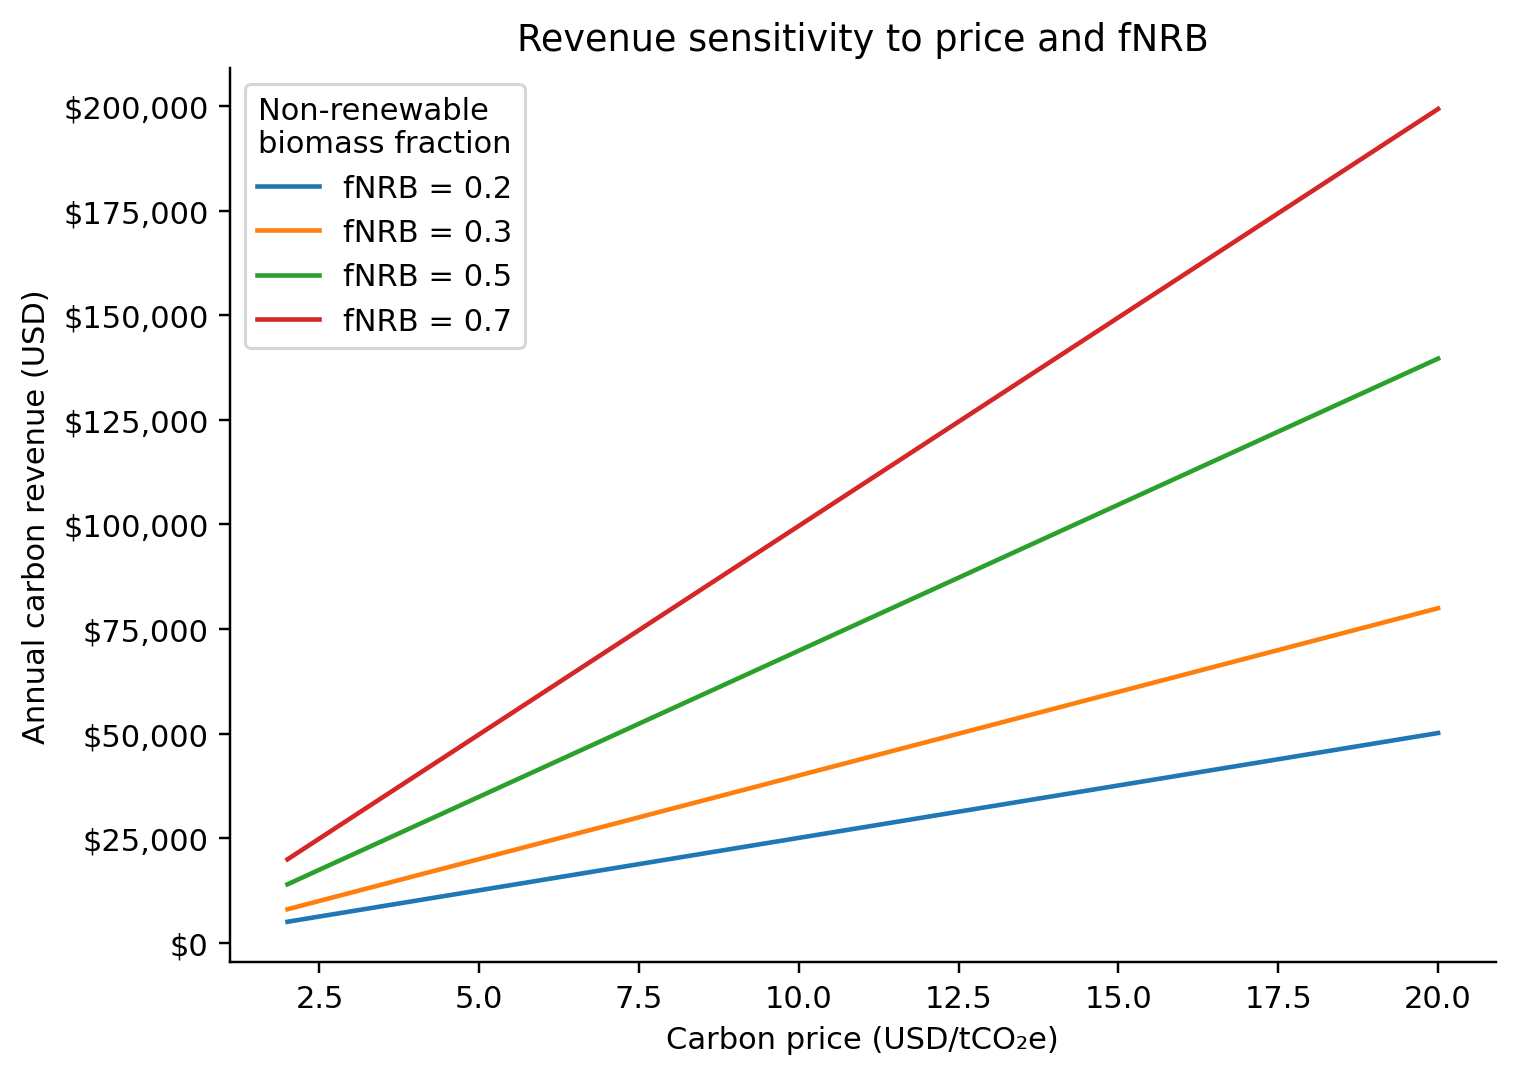
Carbon price and fNRB are the two assumptions the final revenue number is most sensitive to. The chart traces annual portfolio revenue across a range of carbon prices, repeated for four fNRB values, showing that the fNRB assumption acts almost as a multiplier on revenue at any given price, which is why it deserves particular scrutiny (see Methodology above).
Scope, limitations & source code
This is a planning / feasibility model, not a registered PDD. Default factors (fNRB, grid EF, efficiencies) are placeholders for demonstration. For issuance you must use the parameters validated by your VVB and the methodology version registered with Gold Standard / SustainCERT.
This report only shows inputs and results; the full source, the calculations, configuration, and data files are available in the project’s GitHub repository, including instructions for re-running the model with your own portfolio and assumptions.