  total_cost_a total_cost_b saving saving_pct viable
1 6508 4486 2022 31.06945 TRUEIn July 2026, INENSUS, a German mini-grid developer working across rural Africa, put out a short LinkedIn deck with a simple pitch: mini-grids grow faster when they are tied to local value creation. Not just switching the lights on, but giving people a reason to process what they grow or catch closer to home, before it ever leaves the village.
One slide in that deck boils the whole argument down to a single comparison: is it cheaper to truck a raw product out as-is, or to process it locally first using mini-grid power, then truck out something lighter and more stable? It is an easy idea to nod along to. It is much harder to actually check, because a slide is not a model. So I built one, in R, so I could stop nodding and start testing it: a hand-checked example, a breakeven calculation, a sensitivity analysis, a Monte Carlo simulation, and two worked case studies, one coastal, one inland.
Everything below uses synthetic numbers I picked to feel realistic for rural East and Southern Africa. None of it is INENSUS’s own data.
The Model
INENSUS’s formula, in its own words, was:
A = rural raw product price + transport to processing hub + processing cost at hub
B = rural raw product price + local pre-processing with mini-grid electricity + transport to processing hub + processing cost at hub
Read completely literally, that cannot be right. B is just A with one more cost term bolted on, so B could never come out cheaper. That is obviously not the intended point, and the slide’s own notes hint at what is missing: local pre-processing “can reduce weight and volume,” “conservation lowers losses and preserves quality,” and better handling “can also improve profitability.” In other words, once you process locally, the transport and hub-processing costs in B are no longer the same numbers as in A. They shrink, because there is less to truck and less that spoils along the way.
That is the one place this project goes beyond just restating the slide: I turned those side notes into two explicit numbers that flow through the same cost formula.
- Mass retention, how much of the raw weight is still left after local pre-processing. Lower means more water, bone, or husk got stripped out before the truck ever leaves.
- Quality retention, how much value survives the trip without spoiling. Higher means the local step did a better job preserving it.
Scenario A is sell it raw, truck all of it, and accept the spoilage that comes with the trip. Scenario B is spend some mini-grid electricity locally first, then truck a lighter, more stable product. Whether B wins comes down to a simple trade: is what you save on trucking and spoilage worth more than what you spend on the electricity to get there?
We start by carrying out a simple calculation by “hand”, and we shall check it by code later. Take a mid-sized producer 120 km from the nearest hub, with 2,000 kg of raw product a week priced at $1.20/kg, and a local pre-processing step that keeps 55% of the mass and 95% of the quality.
Scenario A, ship it raw: material costs $2,400, transport comes to $2,880, spoilage eats $528, and hub processing adds $700. That is a total of $6,508.
Scenario B, pre-process locally, then ship: material cost is the same $2,400, local processing energy adds $162, and because only 1,100 kg is left to truck after pre-processing, transport drops to $1,584. Quality loss falls to $120, and hub finishing (on the lighter load) is $220. Total: $4,486.
That is a saving of $2,022, about 31% of scenario A’s cost. Now for the R version:
It matches. Local pre-processing saves roughly 31.1% of the total chain cost, even though the electricity itself is not free. Almost all of that saving comes from trucking less weight and losing less to spoilage, which is exactly the mechanism INENSUS’s own Tanzania write-up describes.
From cost to margin
The deck’s next slide is not about total cost, it is about margin: the same three cost pieces (material, processing, transport) stacked up for both setups, with a bigger or smaller gap left over before you hit the sale price. That is worth reproducing here, because if both scenarios sell into the same market at the same price, any saving in cost turns straight into extra margin.
Using an illustrative combined sale value of $8,000 for the batch, just large enough to leave both scenarios in profit:
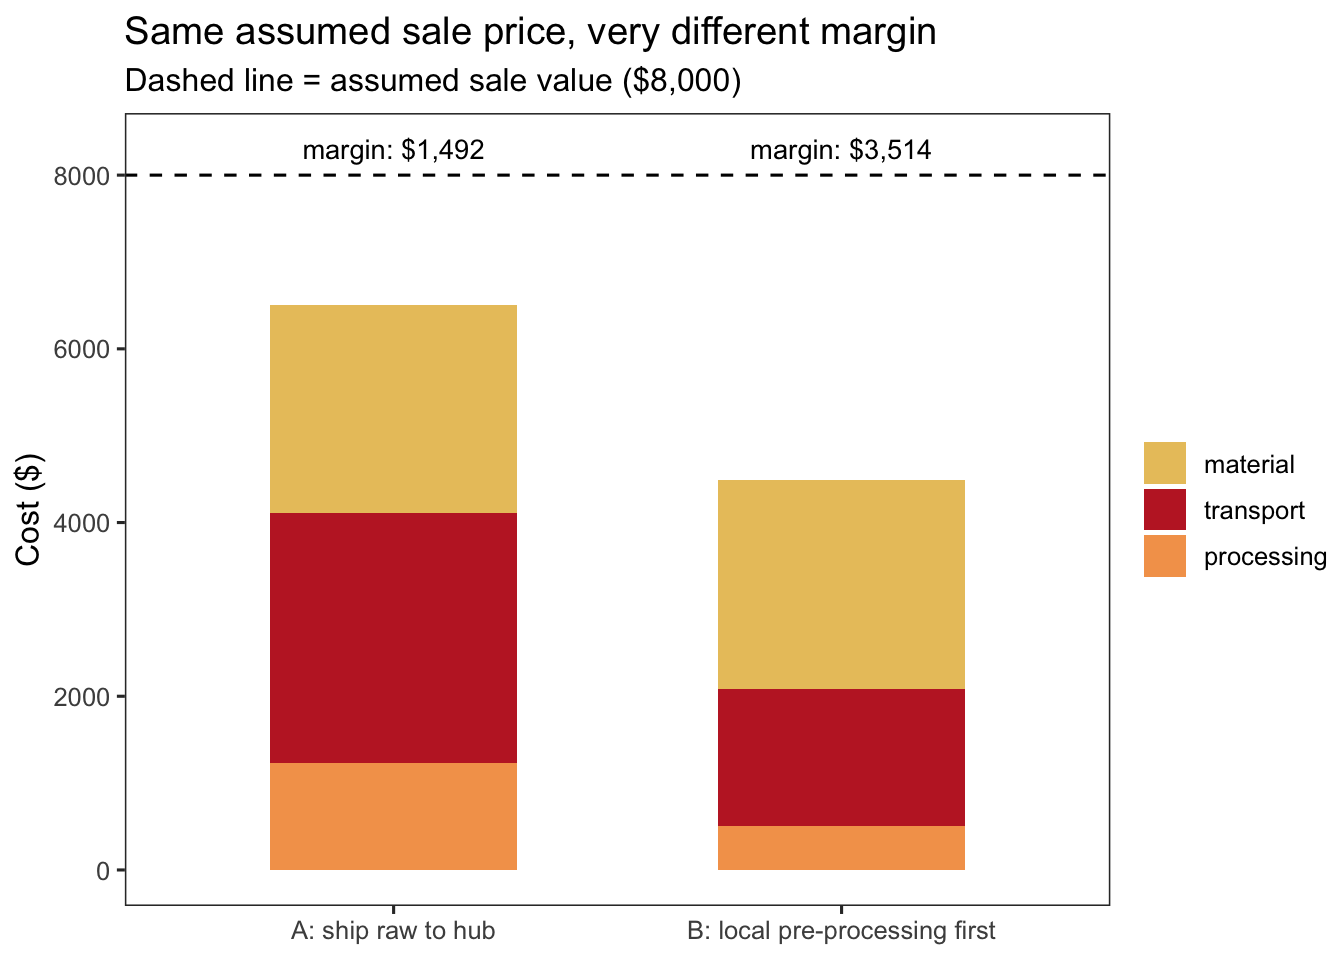
The gap between each cost stack and the dashed sale-price line is the margin, visibly bigger for B, purely because its cost stack is shorter. What this chart still leaves out, and what INENSUS actually spends most of its words on, is whether that $8,000 sale is reliable in the first place. INENSUS calls secure offtake “the missing link,” and nothing in this cost model checks for that. It only tells you the economics work if you can sell the batch.
Where does the local step start paying for itself?
Under the base-case numbers above, local pre-processing pays off at every distance I tested, including a hub right next door. It is not only a transport saving, it also cuts the hub processing bill and the spoilage loss, and both of those help even at distance zero. That is a real result, but it means the base case cannot show a breakeven distance, because there is not one.
So here is a more marginal case: local pre-processing that barely reduces mass, barely improves quality, and runs on a pricier electricity tariff. Here, running the local process really is a cost with only a small payoff, so it only makes sense once the truck ride is long enough to matter.
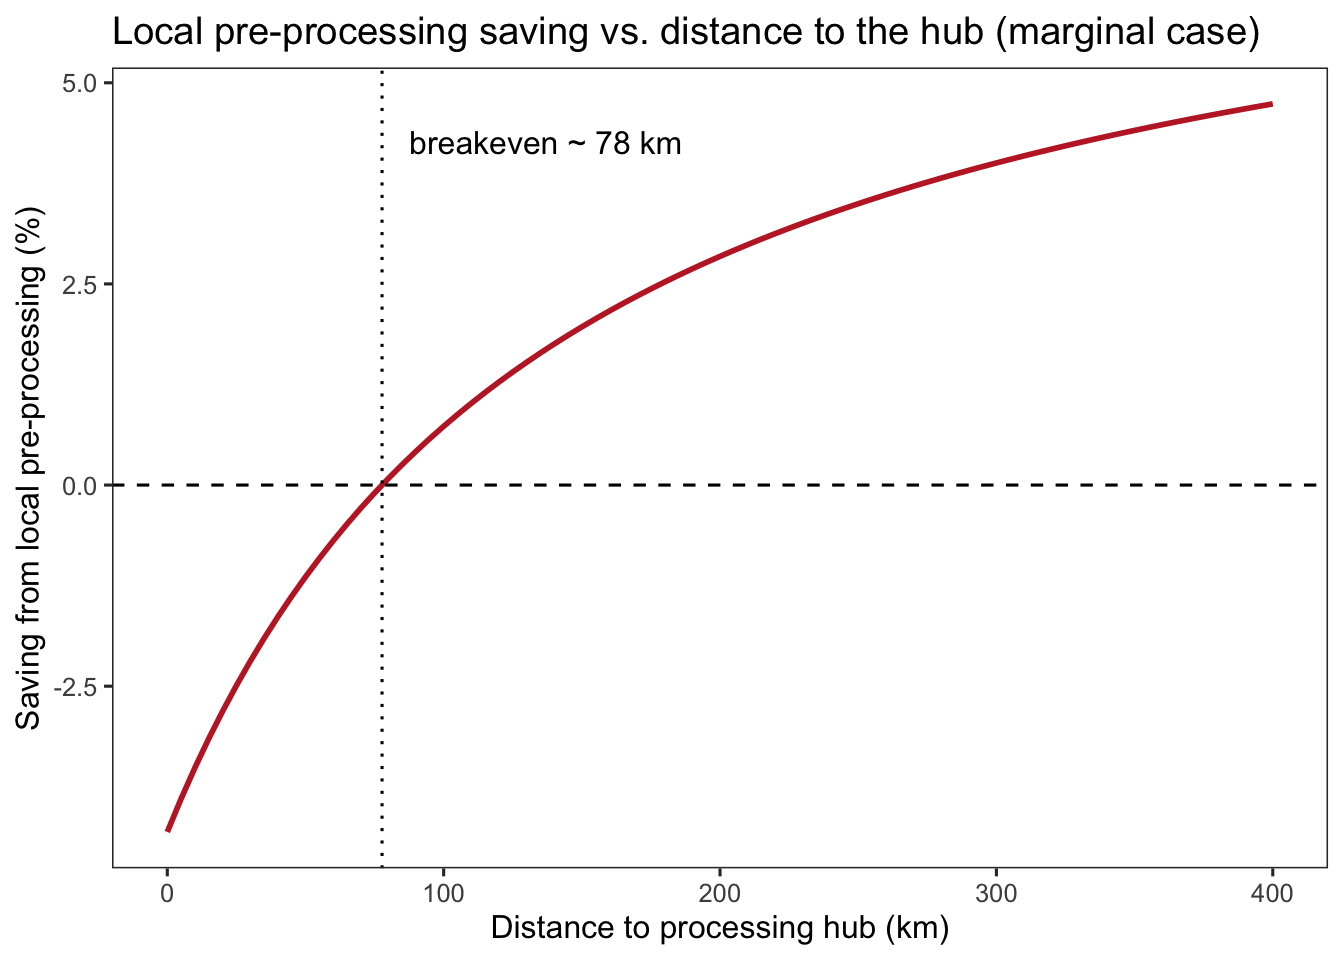
Below roughly 78 km, this marginal process actually costs more than doing nothing. The small mass and quality benefit does not cover the fixed cost of running it locally. Past that distance, the saving turns positive and keeps growing. This is really the quantitative version of INENSUS’s “engines of rural value creation” idea: it depends on the value chain being long enough that trucking raw product genuinely hurts, and, as the fish case study below shows, on the local process actually being good enough to matter.
So what actually moves the needle?
Every number above is an assumption, and some matter far more than others. To see which, I held everything else at the base case and swung one input at a time between a plausible low and high value, a standard one-at-a-time sensitivity check.
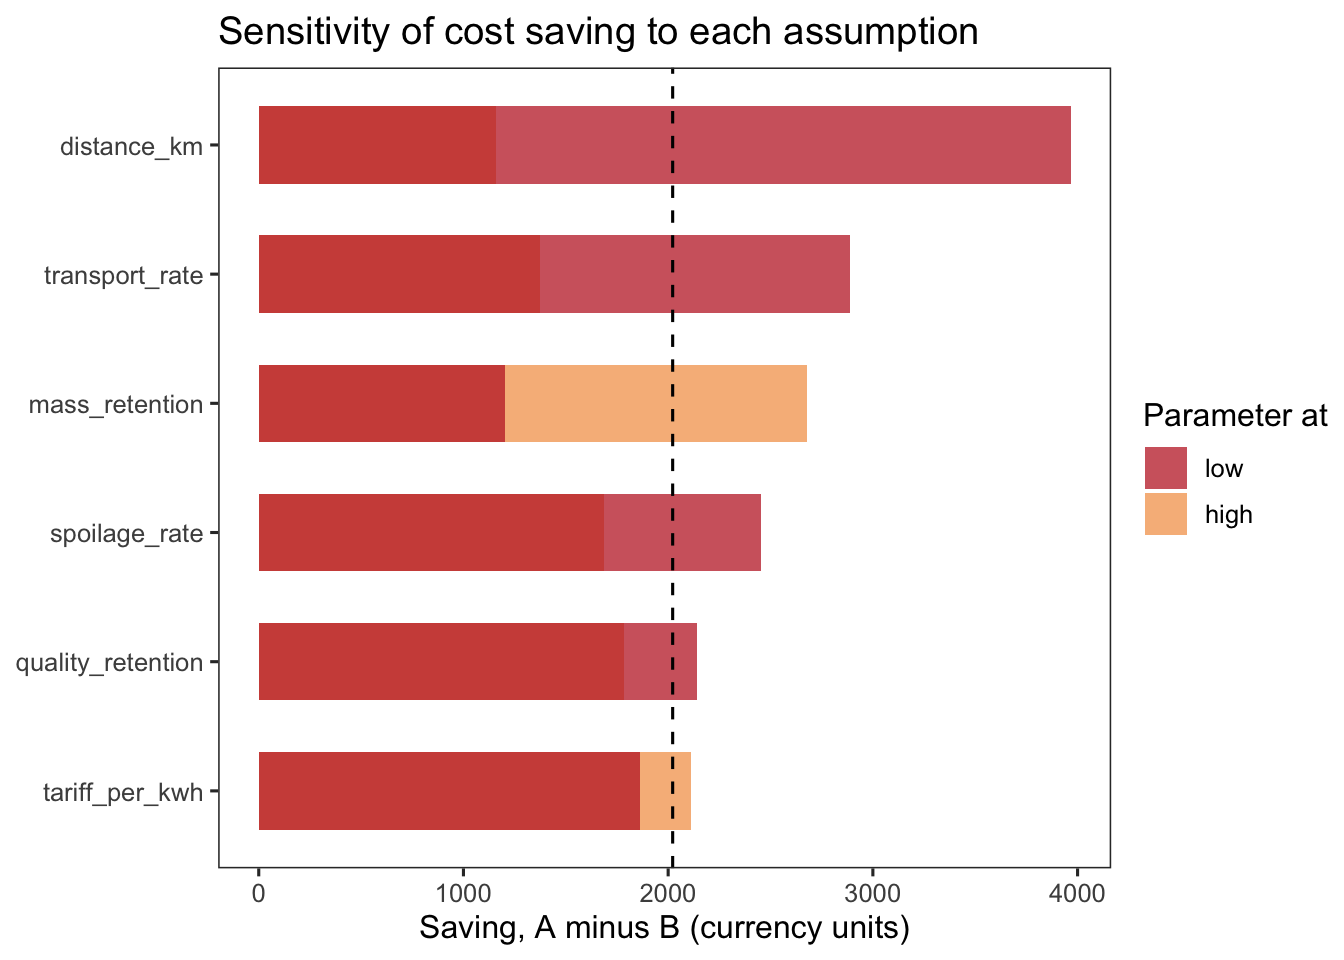
Mass retention, how much weight the local step actually removes, and distance to the hub swing the saving more than anything else. That lines up with INENSUS’s own story about their Tanzania fish pilot: it did not stall because ice was a bad idea, it stalled because ice barely changes the fish’s mass. Meltwater aside, it is still mostly fish in the truck. The pilot only started working once they switched to deep-freezing, a genuine improvement in both mass and quality, not just a colder box.
Does this hold up across a wide range of situations?
One scenario is a single data point. To see how often local pre-processing actually wins, I drew a plausible range for every input at once, five thousand times, and checked how often, and by how much, pre-processing locally beats shipping raw.
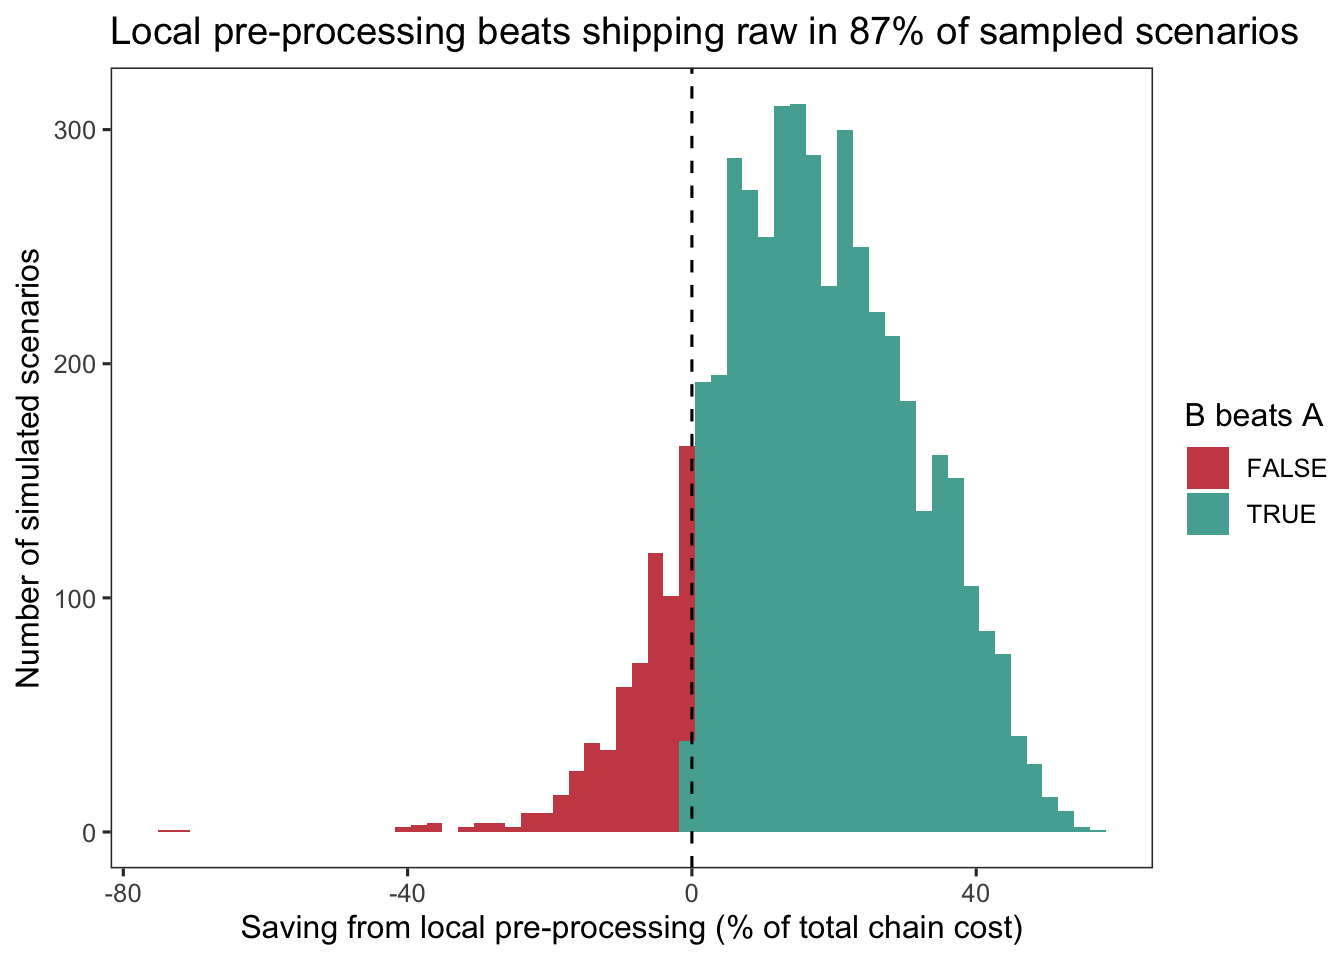
Across these deliberately wide ranges, local pre-processing wins about 87% of the time. The losing tail clusters where mass retention is high (not much weight removed), distance is short, and the electricity tariff is high, all at once, the same two or three levers the sensitivity chart already flagged.
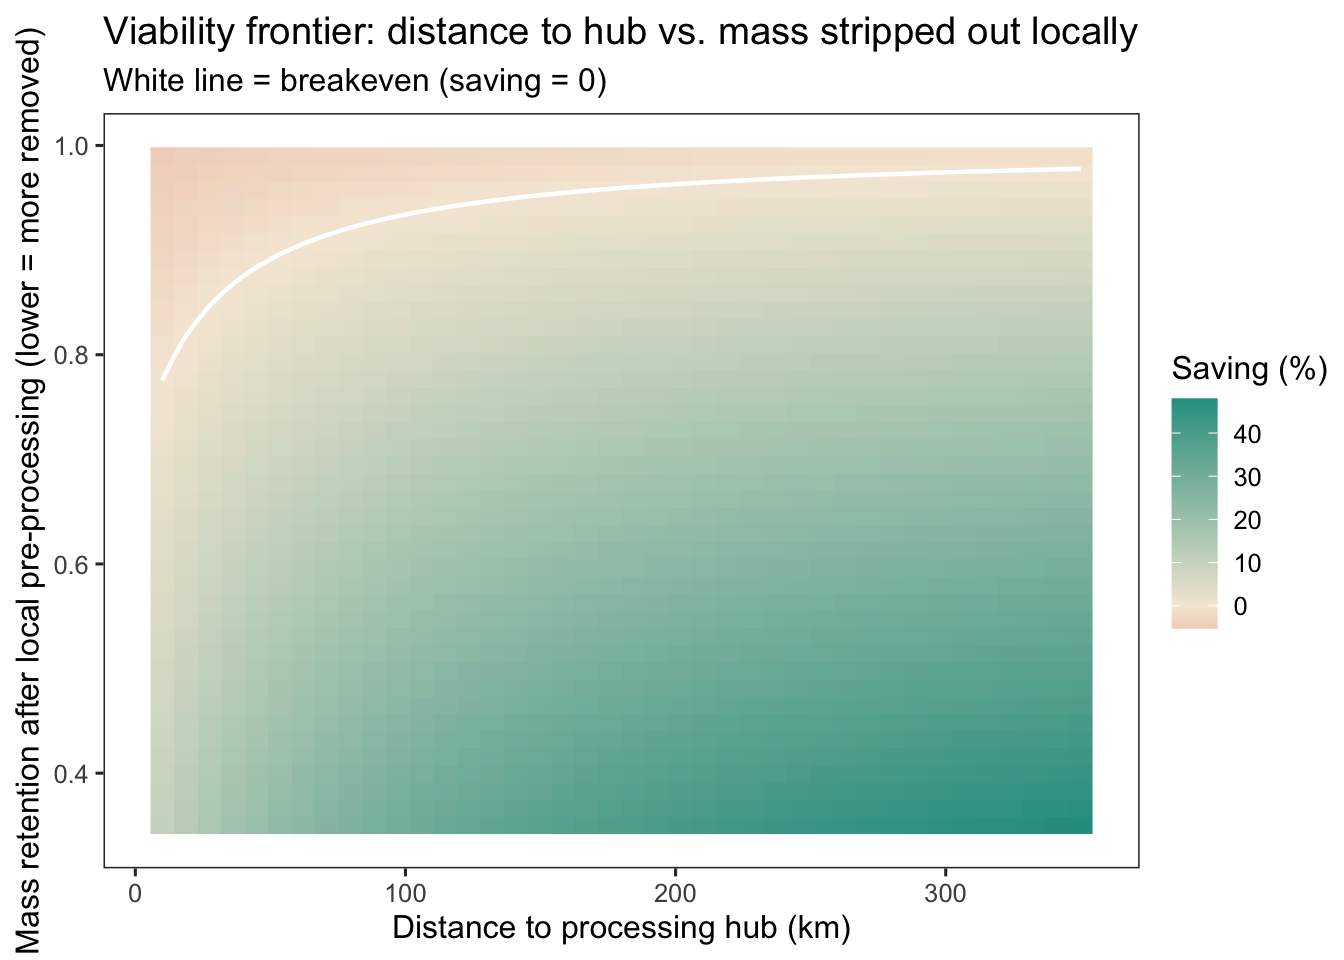
The white line marks that breakeven frontier. Below and to the right of it, short distance aside, low mass retention and a long haul, local pre-processing pays off. Above and to the left, it does not yet, either the hub is too close, or the process is not removing enough weight to be worth the electricity.
Two real-world examples: fish and cassava
A coastal cold chain, fish
This mirrors INENSUS’s own Tanzania story directly: a coastal fishing community near a mini-grid, several hours by road from the nearest urban fish market. Two local options were on the table. Ice cooling is cheap and low-energy, but the fish still loses weight to meltwater, and the cold chain falls apart once the ice runs out. Local deep-freezing needs real electricity, a proper freezer unit on the mini-grid, but keeps both mass and quality far more stable.
               method total_cost_a total_cost_b saving_pct viable
1   Local ice cooling         4304      4137.44   3.869888   TRUE
2 Local deep-freezing         4304      3293.60  23.475836   TRUE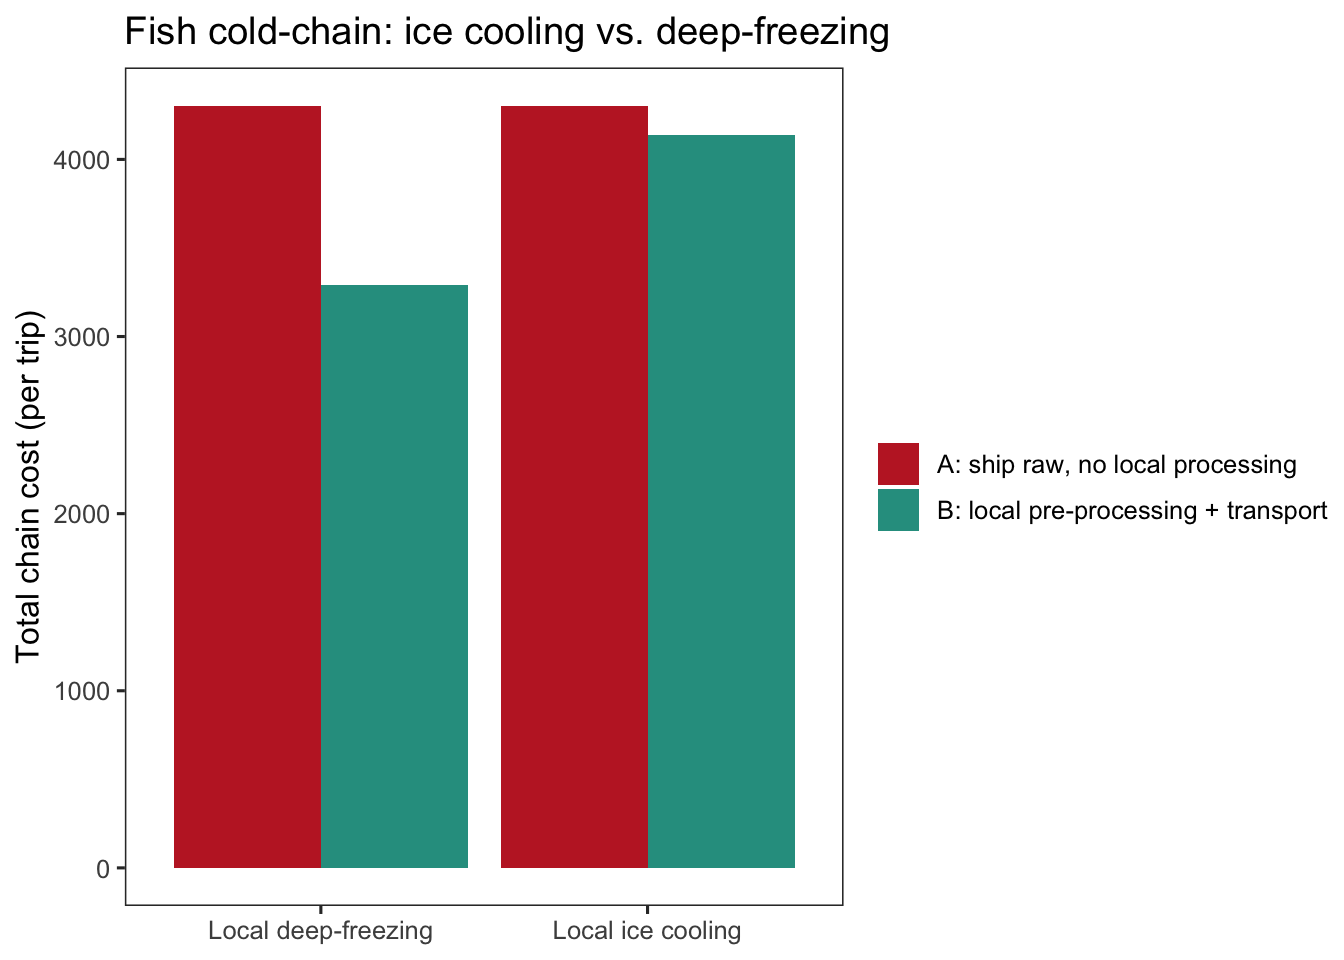
The model reproduces INENSUS’s finding almost exactly. Ice cooling barely beats shipping raw fish out, only 3.9% saved, because it does not remove enough mass and quality still slips before the ice runs out. Deep-freezing wins clearly, 23.5% saved, because that electricity buys both mass reduction and quality stability, not just a colder box.
An inland case, cassava milling
The coastal cold-chain story is the one INENSUS documents, but the same logic holds up inland, far from any coast or river, where the “perishability problem” is really about bulk and moisture rather than spoilage in the usual sense. Picture a small business milling cassava into garri or flour near an inland mini-grid. Scenario A is selling and trucking raw, wet cassava tubers to a regional mill, and cassava is roughly 60-70% water by weight, so most of what gets trucked is water that adds no value at all. Scenario B is grating, pressing, and drying it locally with mini-grid electricity first, then trucking the much lighter, shelf-stable flour to market.
                                         method total_cost_a total_cost_b
1 A: truck raw tubers (baseline, no local step)         4125         4125
2            B: local electric milling + drying         4125         1977
  saving_pct viable
1    0.00000  FALSE
2   52.07273   TRUE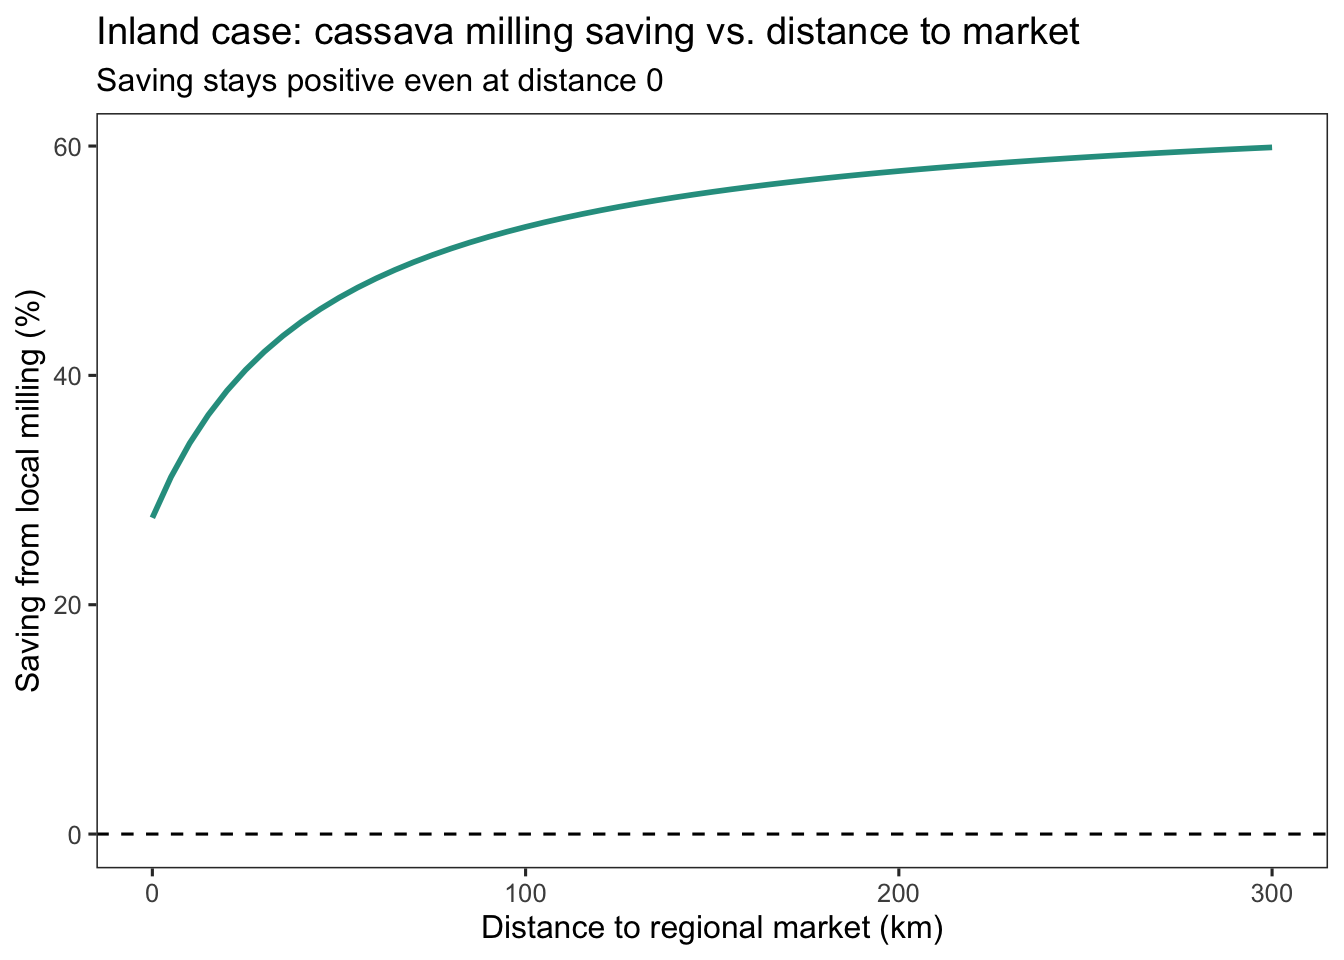
Unlike the marginal breakeven example earlier, this cassava case has no breakeven distance at all in any range worth testing. The saving from local milling, 28% right next to the market, rising to 60% at 300 km, stays positive throughout. Most of raw cassava’s mass is water, and grating, pressing, and drying remove it locally no matter how far the market is. Local milling is not only a transport hedge here, it cuts the processing bill outright. It backs up INENSUS’s broader point too: value creation is not only a coastal cold-chain story, and inland, water-heavy crops can make an even easier case than fish does.
My take away
INENSUS’s one-slide formula survives being turned into an explicit model, once you read past the literal wording. The mechanism, mass and quality retention outweighing the extra local energy cost, holds up under a hand-checked example, a breakeven calculation, and five thousand Monte Carlo draws.
Two levers matter far more than everything else: how much mass or volume the local pre-processing step actually removes, and distance to market. Tariff and raw energy cost matter less than “electricity is expensive out there” intuition might suggest. The same logic applies inland to grain and tuber milling, often even more strongly than the coastal fish case, simply because water weight is such a large share of raw agricultural mass. And cost savings convert directly into margin, but only the cost side is modelled here. Reliable offtake, which INENSUS itself calls the real missing link, is not something a cost formula can verify.
A few honest thoughts
This is a simplified, illustrative simulation, not a validated techno-economic model and not INENSUS’s own data. It leaves out financing costs, seasonality, minimum viable equipment sizes, labour, and offtake reliability, which INENSUS’s own deck flags as the real missing link. Treat it as a way to build intuition about the shape of the problem, not as investment guidance.
Credit: the underlying formula and the Tanzania fish framing are adapted from INENSUS’s “Minigrids & Value Creation” LinkedIn deck (inensus.com, Nico Peterschmidt). All code, parameter choices, the inland cassava case, the margin chart, and the sensitivity and Monte Carlo analysis are my own.